Citigroup projects silver could rise to $30 an ounce in the next six months to a year.
With silver currently in the $23.50 range, this represents a possible 27.66% return.
“We think recent price weakness offers a strong dip-buying opportunity, reiterating our call for $30/oz silver over the next 6-12 months as US growth rolls over, even if emerging markets growth stagnates.”
Silver is currently in a dip. The white metal is down almost 7% this month after cumulative gains of 20% over the past two months. Silver was above $26 at one point. But the dip appears to be temporary.
Citigroup analysts aren’t buying the Federal Reserve’s hawkish posturing. They think interest rates will fall in the near future as a recession takes hold.
“We expect silver would rally in anticipation of the fall in US interest rates and real yields that will likely accompany an anticipated rollover in US growth in Q4’22 or early 2024. This should weigh on the dollar, with Citi economists expecting US rates and the dollar to weaken further.”
Citigroup analysts said these dynamics should underpin demand for ETF silver.
“Weaker competition for investment capital from other asset classes should also support silver pricing as markets increasingly price US recession risks.”
They also expect a potential increase in demand for silver in China.
“Our economists expect China to continue to gradually recover and any associated rebound in EM [emerging market] growth sentiment could be an incremental tailwind for silver. … We expect China demand could recover in 2H 23 following further easing measures by the PBoC.”
There are other bullish signs for silver the Citigroup analysis didn’t mention.
The silver-gold ratio still indicates silver is on sale.
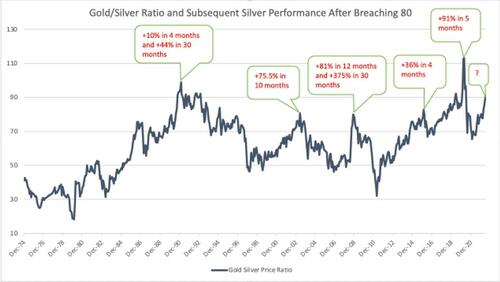
The current silver-gold ratio is just over 83-1. That means it takes over 83 ounces of silver to buy an ounce of gold. To put that into perspective, the average in the modern era has been between 40:1 and 50:1. Historically, the ratio has always returned to that mean. And when it does, it does it with a vengeance. The ratio fell to 30-1 in 2011 and below 20-1 in 1979.
Historically, when the spread gets this wide, silver doesn’t just outperform gold, it goes on a massive run in a short period of time. Since January 2000, this has happened four times. As this chart shows, the snapback is swift and strong.
The supply-demand dynamics also look good for silver.
Silver demand set a record in every category last year, including industrial demand. Industrial offtake accounts for about half of the global demand, and that is only expected to increase in the years ahead as the push toward “green energy” continues.
Silver is an important component in solar panels. According to a study by scientists at the University of New South Wales, solar manufacturers will likely require over 20% of the current annual silver supply by 2027. And by 2050, solar panel production will use approximately 85–98% of the current global silver reserves.
On the other side of the equation, supply was flat last year and it’s expected to be flat again in 2023.
Record global silver demand and a lack of supply upside contributed to last year’s 237.7 million ounce market deficit. It was the second consecutive annual deficit in a row. The Silver Institute called it “possibly the most significant deficit on record.” It also noted that “the combined shortfalls of the previous two years comfortably offset the cumulative surpluses of the last 11 years.”
Based on the supply and demand fundamentals and Citigroup’s analysis, this may be the perfect time to buy silver.


